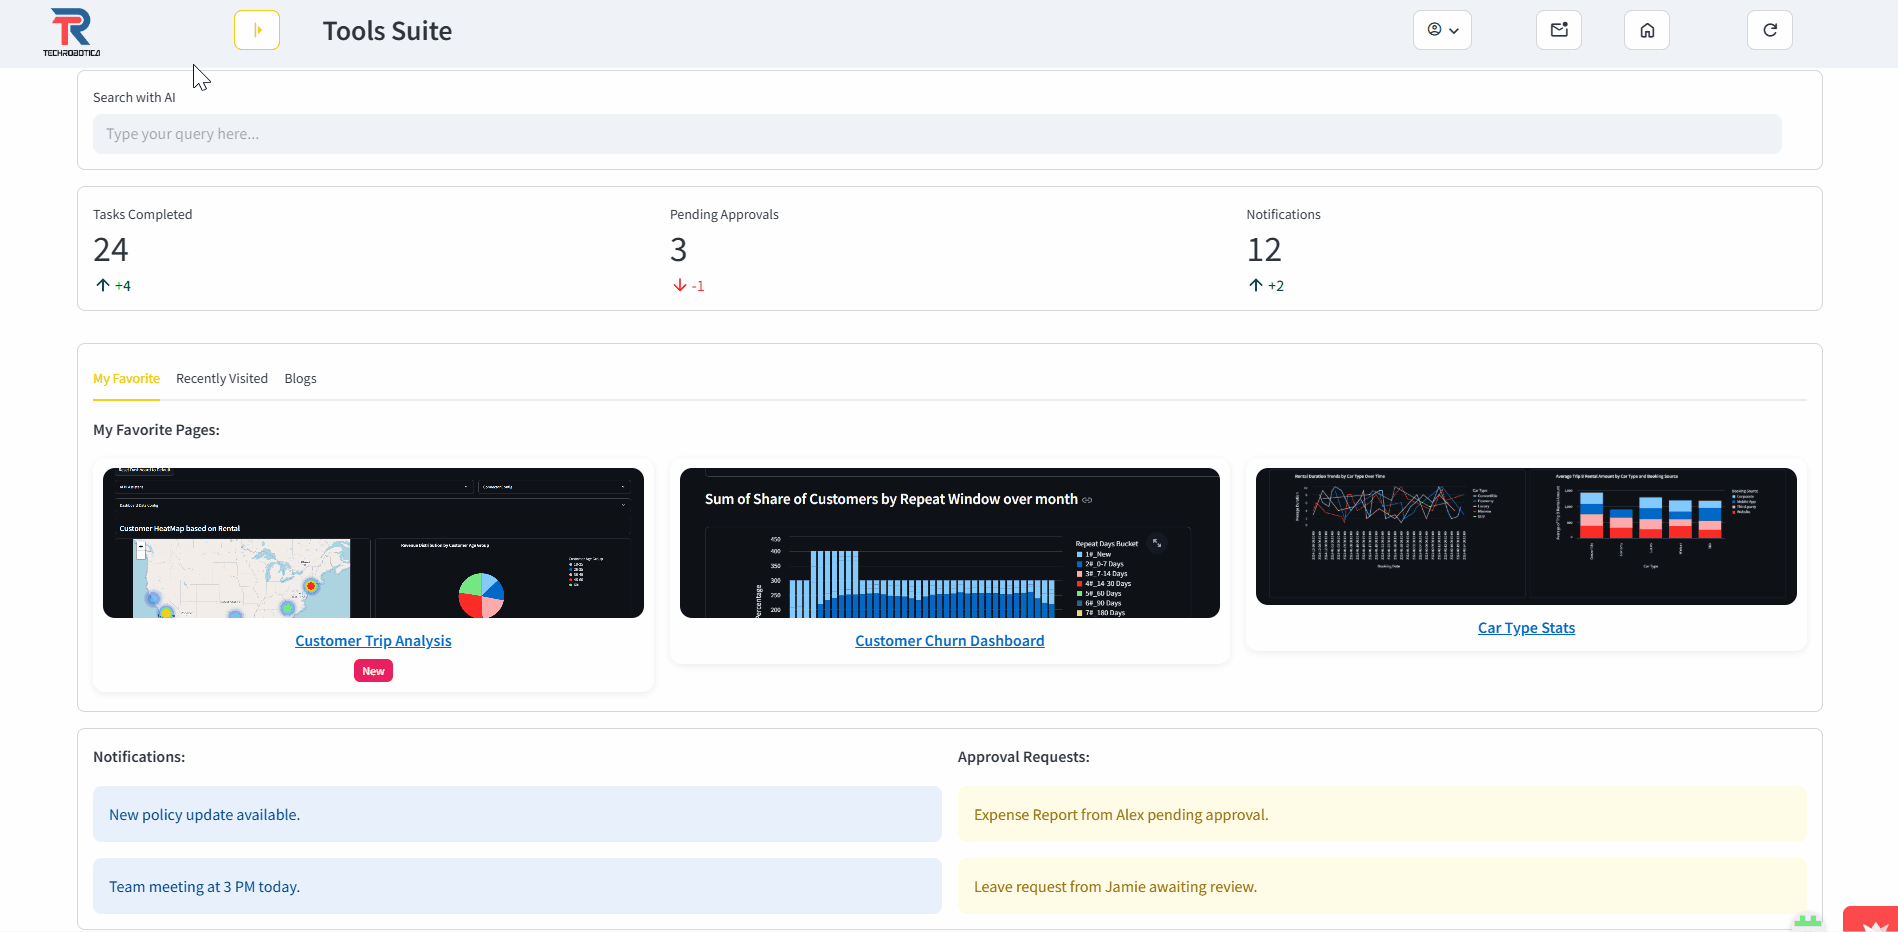
Techrobotica’s intelligent dashboarding engine that lets users generate rich, interactive dashboards simply
by asking questions. Whether you want to track KPIs, uncover trends, or visualize operational metrics,
InsightCraft leverages LLMs to understand your intent and instantly build data-driven dashboards—no coding,
no configuration. Designed for speed, security, and flexibility, it turns your words into visual insights
within seconds, empowering teams to make decisions in real time.
SEN AI BI Developer
SEN AI BI Developer is a powerful tool that allows users to create complex, interactive dashboards using natural
language queries. It leverages the capabilities of Large Language Models (LLMs) to understand user intent and
generate visualizations on-the-fly, making data analysis accessible to everyone, regardless of technical
expertise.
Where Business Intelligence Designs Itself
Introduction
What It Creates
How It Works
Why Businesses Love It
Introducing SEN AI BI Developer
Imagine walking into a meeting, speaking your question aloud, and watching a fully interactive
dashboard appear in seconds.
No searching for data. No tweaking chart settings. No endless iterations.
That’s the magic of SEN AI BI Developer—your AI-powered dashboard architect, built on the Smart
Enterprise Nexus (SEN).
From intent to insight—at the speed of thought. With a single prompt or voice command, it:
✔ Selects the most meaningful visuals automatically
✔ Builds entire BI experiences with filters, drill-downs, and responsive layouts
No configurations. No delays. Just business intelligence that builds itself.
What It Creates for You
Orchestrated via BOSS Catalog, it ensures every visualization is accurate, trusted, and
business-ready.
✔ Stunning Graphs & Charts – Designed for clarity, matched to your dataset’s story
✔ Geo-Spatial Maps – Interactive heatmaps & layered location views
✔ Data Lists & Tables – Inline sorting, filtering, and highlighting
✔ Drill-Down & Hierarchical Views – From overview to transaction detail
✔ Conditional Formatting – Spot trends, risks, and outliers instantly
✔ Filter Engines & Search Bars – Slice data without complex queries
✔ Summary Cards & KPIs – At-a-glance insights for decision-makers
✔ Interactive Changes – Switch chart types or add metrics instantly
Every dashboard tells a story—automatically, intelligently, and beautifully.
How It Works Across the SEN Platform
SEN AI BI Developer works seamlessly with your governed datasets and the Mystic BI analytics suite.
Orchestrated via BOSS Catalog, it ensures every visualization is accurate, trusted, and
business-ready.
✔ BOSS Catalog – Access governed, secure, high-quality datasets
✔ Mystic BI – AI-powered analytics, storytelling, and metrics
✔ Integrated Filters – Cross-dashboard slicing and drill-down
✔ Smart Visualization – Auto-selects the best format for the data
✔ Real-Time Updates – Dashboards evolve as your business questions change
From raw data to polished dashboards—in minutes, not weeks.
Why Businesses Love It
✔ Zero Learning Curve – If you can ask a question, you can build a dashboard
✔ Consistent Excellence – Best practices in visualization & storytelling
✔ Lightning-Fast Delivery – From data to BI in minutes
✔ Interactive Evolution – Adapts instantly to new questions
Analytics without friction—so leaders focus on decisions, not dashboards.
Did you find what you were looking for today?
Let us know so we can improve the quality of the content on our pages.